LoRaScope is a product I designed, build and consult around. It captures LoRa
traffic live, decodes packets, and shows who is transmitting, how often, and
whether the link is healthy. It works at the radio layer, so you can debug a
site even where there is no LoRaWAN network server and no gateway to log into.
One analyser covers LoRaWAN, LoRaBASIC and MeshCore through the same
interface.
What it does
Capture & decode
Match a sender’s sync word, spreading factor, bandwidth and coding rate, and
LoRaScope decodes raw frames as they arrive at the radio, without a gateway or
network server. Save them to a capture store to filter, search, export and
replay later.
Spectrum & link health
RSSI, SNR, source, payload, collisions and duty cycle, live, so problems on a
busy or marginal band can be seen.
Emulate & inject
Emulate the hub or any node. Inject traffic to test a node in isolation,
reproduce a fault or validate firmware without disturbing production hardware.
Agent & script control
The live feed and the controls are exposed over telnet and REST, so a
script or an AI agent can monitor the band, act on it and observe the result.
See AI & Automation.
Related work
LoRa Gateway: bridging a local LoRa network to the wider world
A local LoRa band can be busy, with dozens of sensors reporting temperatures,
tank levels, gate states and soil moisture every few minutes. You rarely want
all of that going out over a satellite link that charges per byte. The gateway
watches every packet and forwards what your rules select: for example a daily
aggregate over Iridium at 09:00, an SMS if a pump fails, or a live mobile-data
dashboard for the operator on the hill.
What it does
Multi-transport backhaul
Forward traffic over LoRaWAN to a remote site, over Iridium / LEO satellite
when there is no tower in sight, over LTE mobile data, or as SMS
alerts, queuing and transmitting as each link allows.
Rules engine
Define what leaves the site and when (thresholds, schedules, aggregates and
alerts) so the expensive links carry only the data you need.
MeshCore relay
Bridge a local network into a wider MeshCore mesh for coverage around obstacles
and across distance, with multi-radio setups where needed.
Remote access tunnel
Reach the gateway and the devices behind it from anywhere, securely, for
configuration and diagnostics, without driving out to the site.
Related work
LoRaScope: the analyser the gateway is built alongside
Instrumenting LoRa networks so an AI agent or any script can monitor, test and diagnose them in a closed loop.
Let an AI agent watch and drive the LoRa band
LoRaScope exposes its feed and controls over telnet and REST, so an agent or any script can watch the band, act on it and observe the result without a person in the loop.
LoRaScope exposes its live feed and its
controls over telnet and REST. An agent can watch the band, read decoded
packets, run custom decoders, then inject and emulate traffic to test a
hypothesis and watch the result, and repeat. Because it works at the radio
layer, an agent can instrument a site even where there is no LoRaWAN network
server and no gateway to log into.
What it enables
See: agent-readable
Stream the live decoded-packet feed (RSSI, SNR, source, payload, timestamps)
over telnet or REST, and query the capture store, link health and historical
logs. Every packet is also logged to SD as CSV.
Act: agent-controllable
Switch channel and protocol, inject packets, and emulate a hub or node through
the same API for every stack (LoRaWAN, LoRaBASIC and MeshCore).
Loop: closed-loop diagnosis
With both, an agent can run fault diagnosis on its own: form a hypothesis,
inject a test, read the result, and narrow down a problem without a person on
site.
MeshCore, LoRaWAN and ChirpStack work, the radio and networking layer beneath my monitoring products.
Mesh & LoRa Networking
The radio and networking layer that ties sensors, hubs, and gateways together across distance and obstacles.
Overview
Most of my remote-monitoring work runs on long-range, low-power radio with no
telco link. I design and deploy point-to-point LoRa, MeshCore mesh
networks, and LoRaWAN with a ChirpStack network server, and pick the
stack that suits the site.
What I work with
MeshCore
Self-healing mesh for coverage around obstacles and across distance. I run the
AU915 Victoria preset by default, with an SF12 / BW125 long-range alternative
for the hardest links, across Companion, Repeater, Sensor, and Room Server
firmware roles.
LoRaWAN & ChirpStack
Standards-based LoRaWAN with a self-hosted ChirpStack network server, Cayenne
LPP payload encoding, and integration into local and cloud data pipelines.
Hardware
ESP32, nRF52840, RAK4631, Heltec V3, SenseCAP T1000-E and RP2040-class nodes,
with custom firmware in C++ and deep-sleep designs for multi-year battery
life.
Tuning & diagnosis
When the defaults do not fit a site, I tune the link and check it with
LoRaScope, measuring spectrum, collisions and
link health at the radio layer.
OGLAS is the monitoring product line I build for off-grid and poorly connected
sites: farms, fishing boats, golf-cart fleets, forklifts, factories and remote
power installations. It measures and controls things in the field, gets the data
to where you can use it, and raises an alert when something needs attention.
The pipeline is Sensors → Hubs → Local → Cloud, and I build
the custom version of any link in that chain.
There are no subscriptions and no telco dependency, and the data stays yours.
How it fits together
Sensors
Measure or switch tank and trough level, soil moisture, power, gate and asset
state, vehicle and engine, weather, smoke and gas. Long-range wireless, built
to run off-grid.
Hubs
On-site receivers that collect sensor data and hand it on: LoRa, mesh and
satellite hubs, with optional large or small displays. See
Mesh & LoRa and the
Gateway.
Local
Browse and analyse your data on site, on an SBC or a laptop. It backs up and
manages data across every hub, and the data stays local.
Cloud
An optional private copy off-site, over LTE, Wi-Fi, satellite or HaLow. View
it from your phone while you are away, and share it with whoever you choose.
Custom builds
Most of the work is bespoke: sensors, hubs, monitoring, alerts, and data
analysis and presentation for sites where nothing off the shelf fits. If you
have something that needs watching, online or off-grid, get in touch.
Production Zephyr firmware. BLE provisioning, WiFi, LoRa, OTA, crash reporting, storage, displays and multi-year battery life, shipping in the OGLAS v2 platform.
Zephyr RTOS in production firmware
The full connected-device stack on Zephyr (BLE configuration, WiFi, LoRa,
over-the-air updates, crash reporting, storage, displays and multi-year
battery life), shipping today in the second-generation OGLAS firmware across
nRF52840, ESP32 and STM32.
Zephyr is my RTOS of choice for connected products. It is vendor-neutral, so
the same codebase runs on Nordic, Espressif and ST silicon. Devicetree and
Kconfig keep board differences out of application code, west manages builds
and dependencies, and Bluetooth, networking, power management, storage and
firmware update are maintained subsystems in the tree.
Every capability below is shipping in the second-generation
OGLAS firmware, in hubs and sensors
deployed to off-grid sites where a locked-up device cannot be fixed by driving
out to it. So the devices have to configure themselves in the field, update
themselves remotely, report their own crashes and run for years on a battery.
Capabilities
BLE configuration & provisioning
Custom GATT services for on-site commissioning: set WiFi credentials, radio
settings and site parameters from a phone, with secure pairing. There is no
serial cable or laptop needed in the paddock.
WiFi
Station and access-point provisioning flows, credential storage, and
reconnect handling for networks that come and go, including BLE/WiFi
coexistence on ESP32-class parts.
LoRa & long-range radio
Zephyr LoRa on SX126x-class radios (RAK4631 / nRF52840), the radio layer
under the OGLAS sensor network. See the
Mesh & LoRa and
Gateway pages.
Long-term battery management
Zephyr device power management, sleep states and duty-cycling for multi-year
field life, with battery telemetry so a fading device shows up in the data
well before it stops reporting. Ultra-low-power deep-sleep design is a
speciality.
OTA updates
MCUboot dual-slot images with signed firmware and rollback, delivered over
BLE or WiFi to devices you may never physically touch again. A failed update
falls back to the previous image.
Crash reporting
Fault handlers, coredumps, and persisted crash and reboot-reason logging, so
a field failure comes home with the data. That is how the rare bugs get
found.
Storage & settings
NVS and the Zephyr settings subsystem for configuration and calibration, and
flash filesystems for data logging, all designed to survive power loss,
because off-grid power fails without warning.
Displays
OLED, eInk and LCD panels under Zephyr’s display subsystem and LVGL, from
always-on status screens to eInk that draws no power between refreshes. See Custom Displays.
RTC & timekeeping
Battery-backed RTC and time synchronisation across sensors and hubs, so data
from an off-grid site is correctly timestamped even after weeks with no
uplink and no NTP.
Platforms
One application codebase with per-board devicetree overlays and Kconfig
fragments. That is the point of Zephyr, and it is how the OGLAS v2 firmware
is structured.
Platform
Boards
Strengths
nRF52840
RAK4631, SenseCAP T1000-E
BLE + SX1262 LoRa, exceptional sleep currents
ESP32 / ESP32-S3
Heltec V3 and custom boards
WiFi + BLE, displays, plenty of headroom
STM32
Custom and off-the-shelf boards
Wide part range, industrial peripherals, RTC
In production in OGLAS v2
The second-generation OGLAS hub and
sensor firmware is built on Zephyr and uses everything on this page in
production: BLE-commissioned, LoRa-connected, OTA-updatable devices that log
locally, report their own faults and run unattended for years. If your
product needs the same, I can help.
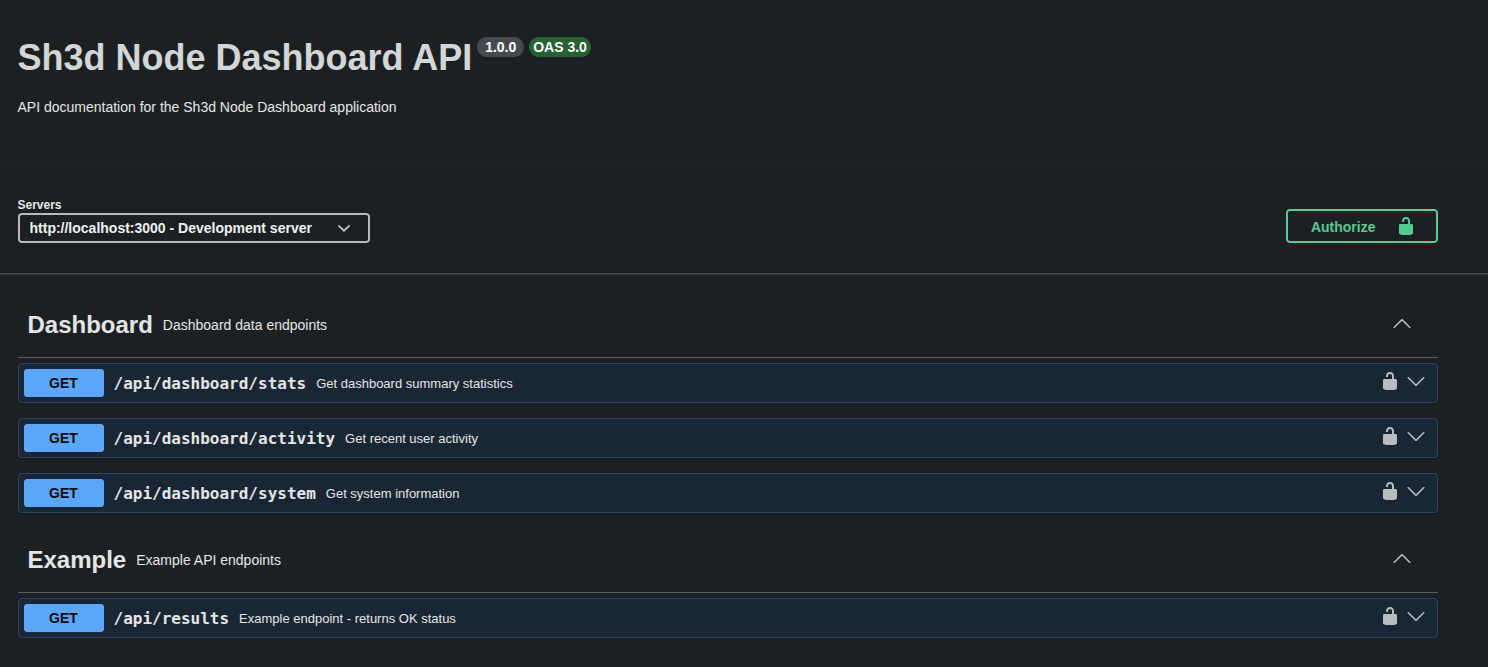
APIs built for the job, with documentation, authentication, load control and testing tools.
What I Build
Features
Documentation generated from the code, so it stays current
Authentication: token-based, role-based or custom schemes
Load control: rate limiting and queuing
Testing tools: built-in test interfaces for development and QA
Versioning, so older clients keep working as the API changes
Approach
REST-first design with clear, consistent endpoints
Designed for internal integration and for external clients
Consistent error handling and status codes
Tuned for high request rates where needed
Built to integrate with existing systems and data sources
Documentation & Testing
Built-in API documentation and interactive testing interface
8 - Custom Authentication
Custom Authentication Solutions
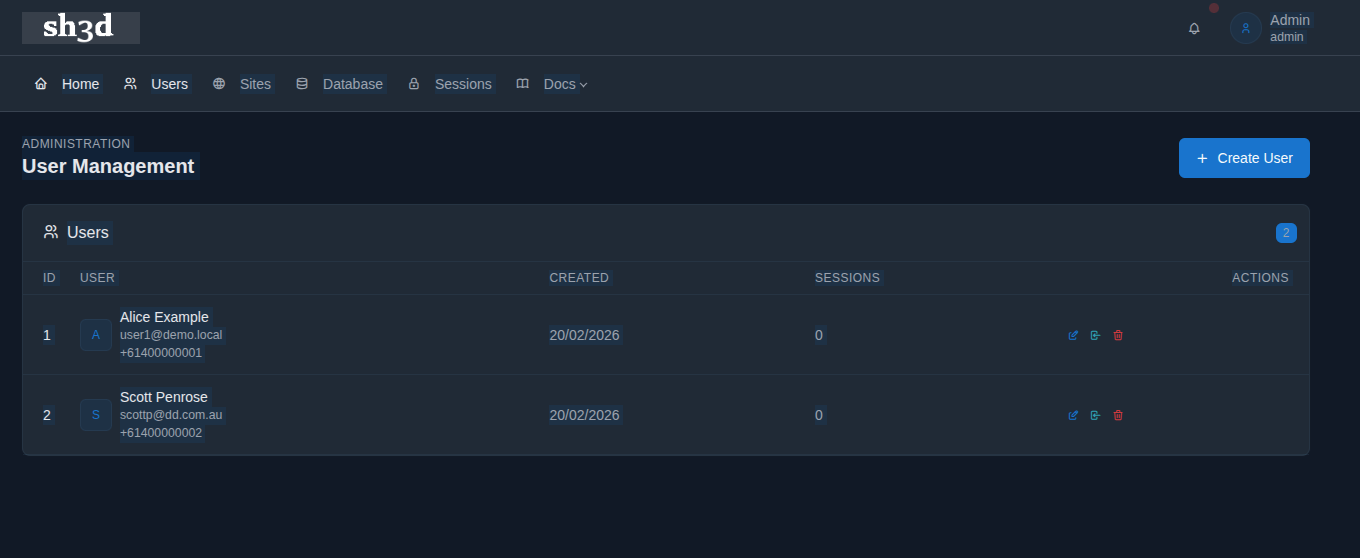
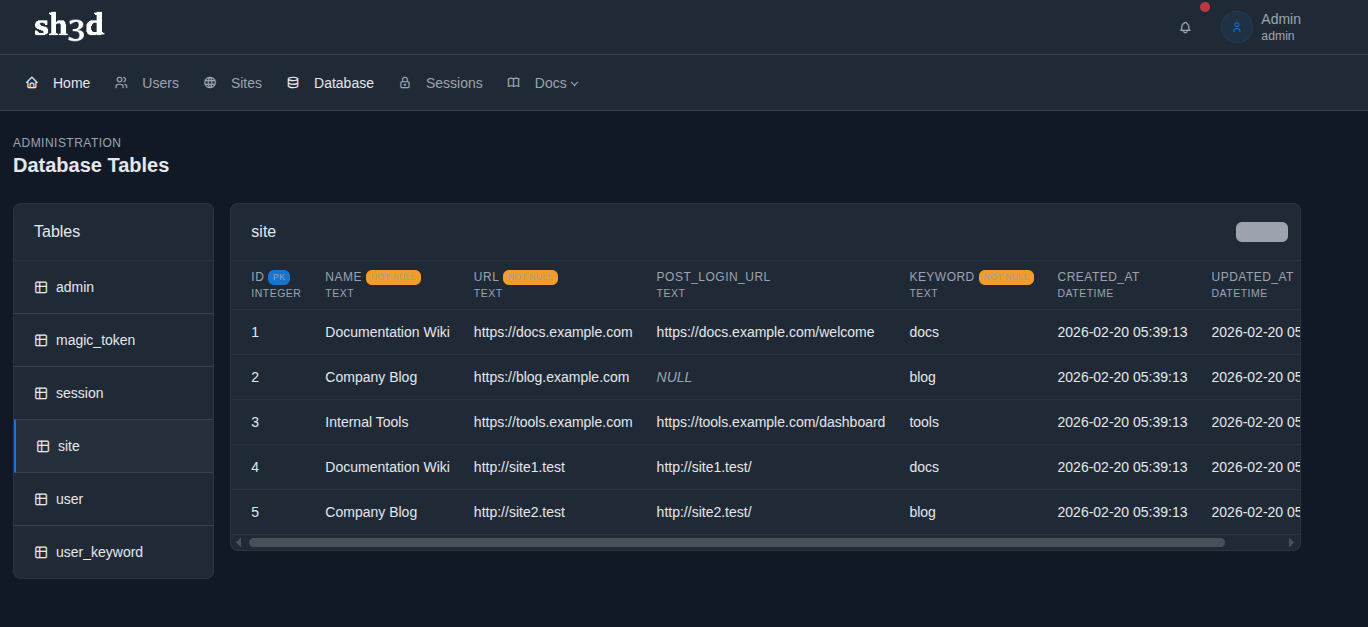
One identity system across several sites, with a choice of authentication methods, admin dashboards and database views.
Capabilities
Multi-Site Identity
A single authentication system across several web properties, with one place to manage users and the same login on each site.
Admin Dashboards
Management interfaces for user administration, role assignment and account oversight, designed with the staff who use them.
Flexible Methods
Token-based, session-based or custom authentication flows, with role-based access control throughout.
Screenshots
User management: view and edit user details, roles and permissions
Custom database views and tables for direct data inspection
9 - Custom Displays
Embedded Display Solutions
Display systems for solar monitoring, industrial data visualisation and long-running embedded applications.
Capabilities
Any Size
From small status indicators to full OLED and eInk panels, matched to the use and the environment.
Always On
Designed for long-running, unattended operation with automatic logging and ultra-low power consumption.
Interactive
Touch input and scroll navigation on embedded displays, so the panel can be used to control the device as well as read it.
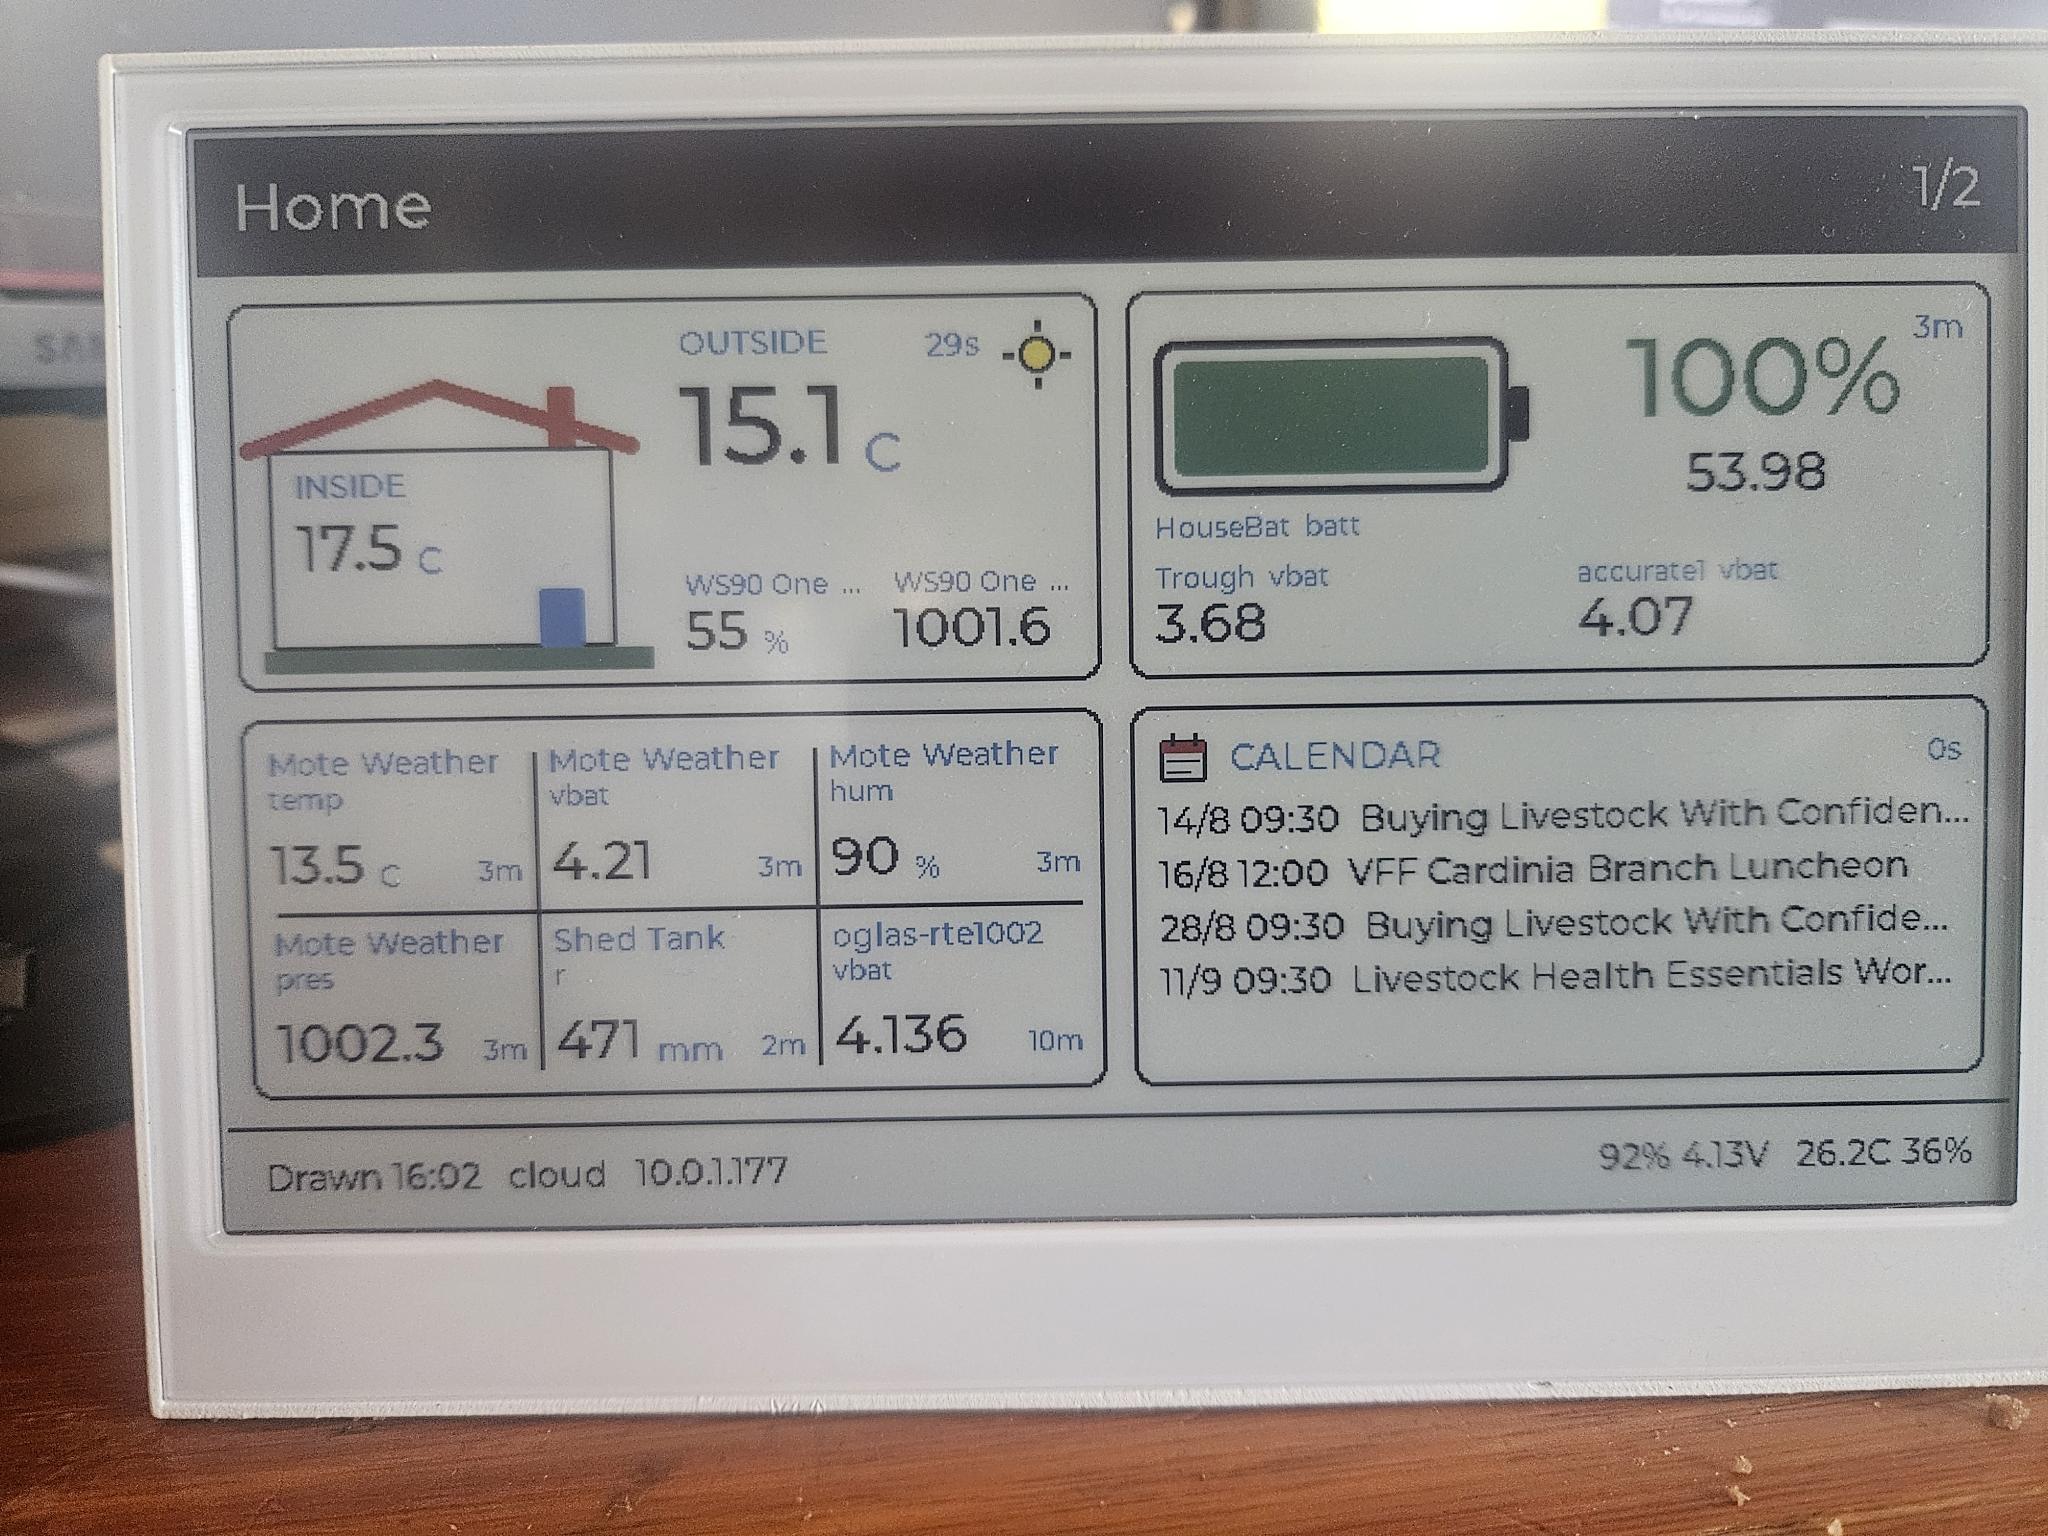
Featured Build: Battery E-Paper Dashboard
A battery-powered colour e-paper dashboard showing site readings, battery states and a calendar, running for months on a charge
A wall or bench dashboard on 800 x 480 colour e-paper (E Ink Spectra 6, ESP32-S3). It renders typed pages (a home summary, calendar, power, battery), each tile stamped with its data age, and the whole unit is provisioned from a phone: an unconfigured panel comes up as its own access point with a QR code to join it.
E-paper draws no power between refreshes, so at a 90-minute update interval the panel runs about three months per charge. The power budget comes down to how often you draw.
Resilient Networking
Stores up to four WiFi networks and joins the strongest in range, with primary and fallback REST data endpoints. The footer shows which source drew the screen.
Months Per Charge
The picture stays on the glass with the power off. The panel wakes, fetches, draws and sleeps, and runs around three months on a cell at 90-minute refreshes, with its own battery state in the footer.
Sensors Onboard
Reports its own temperature, humidity and battery voltage alongside the data it displays, so the panel is also a sensor node in the room.
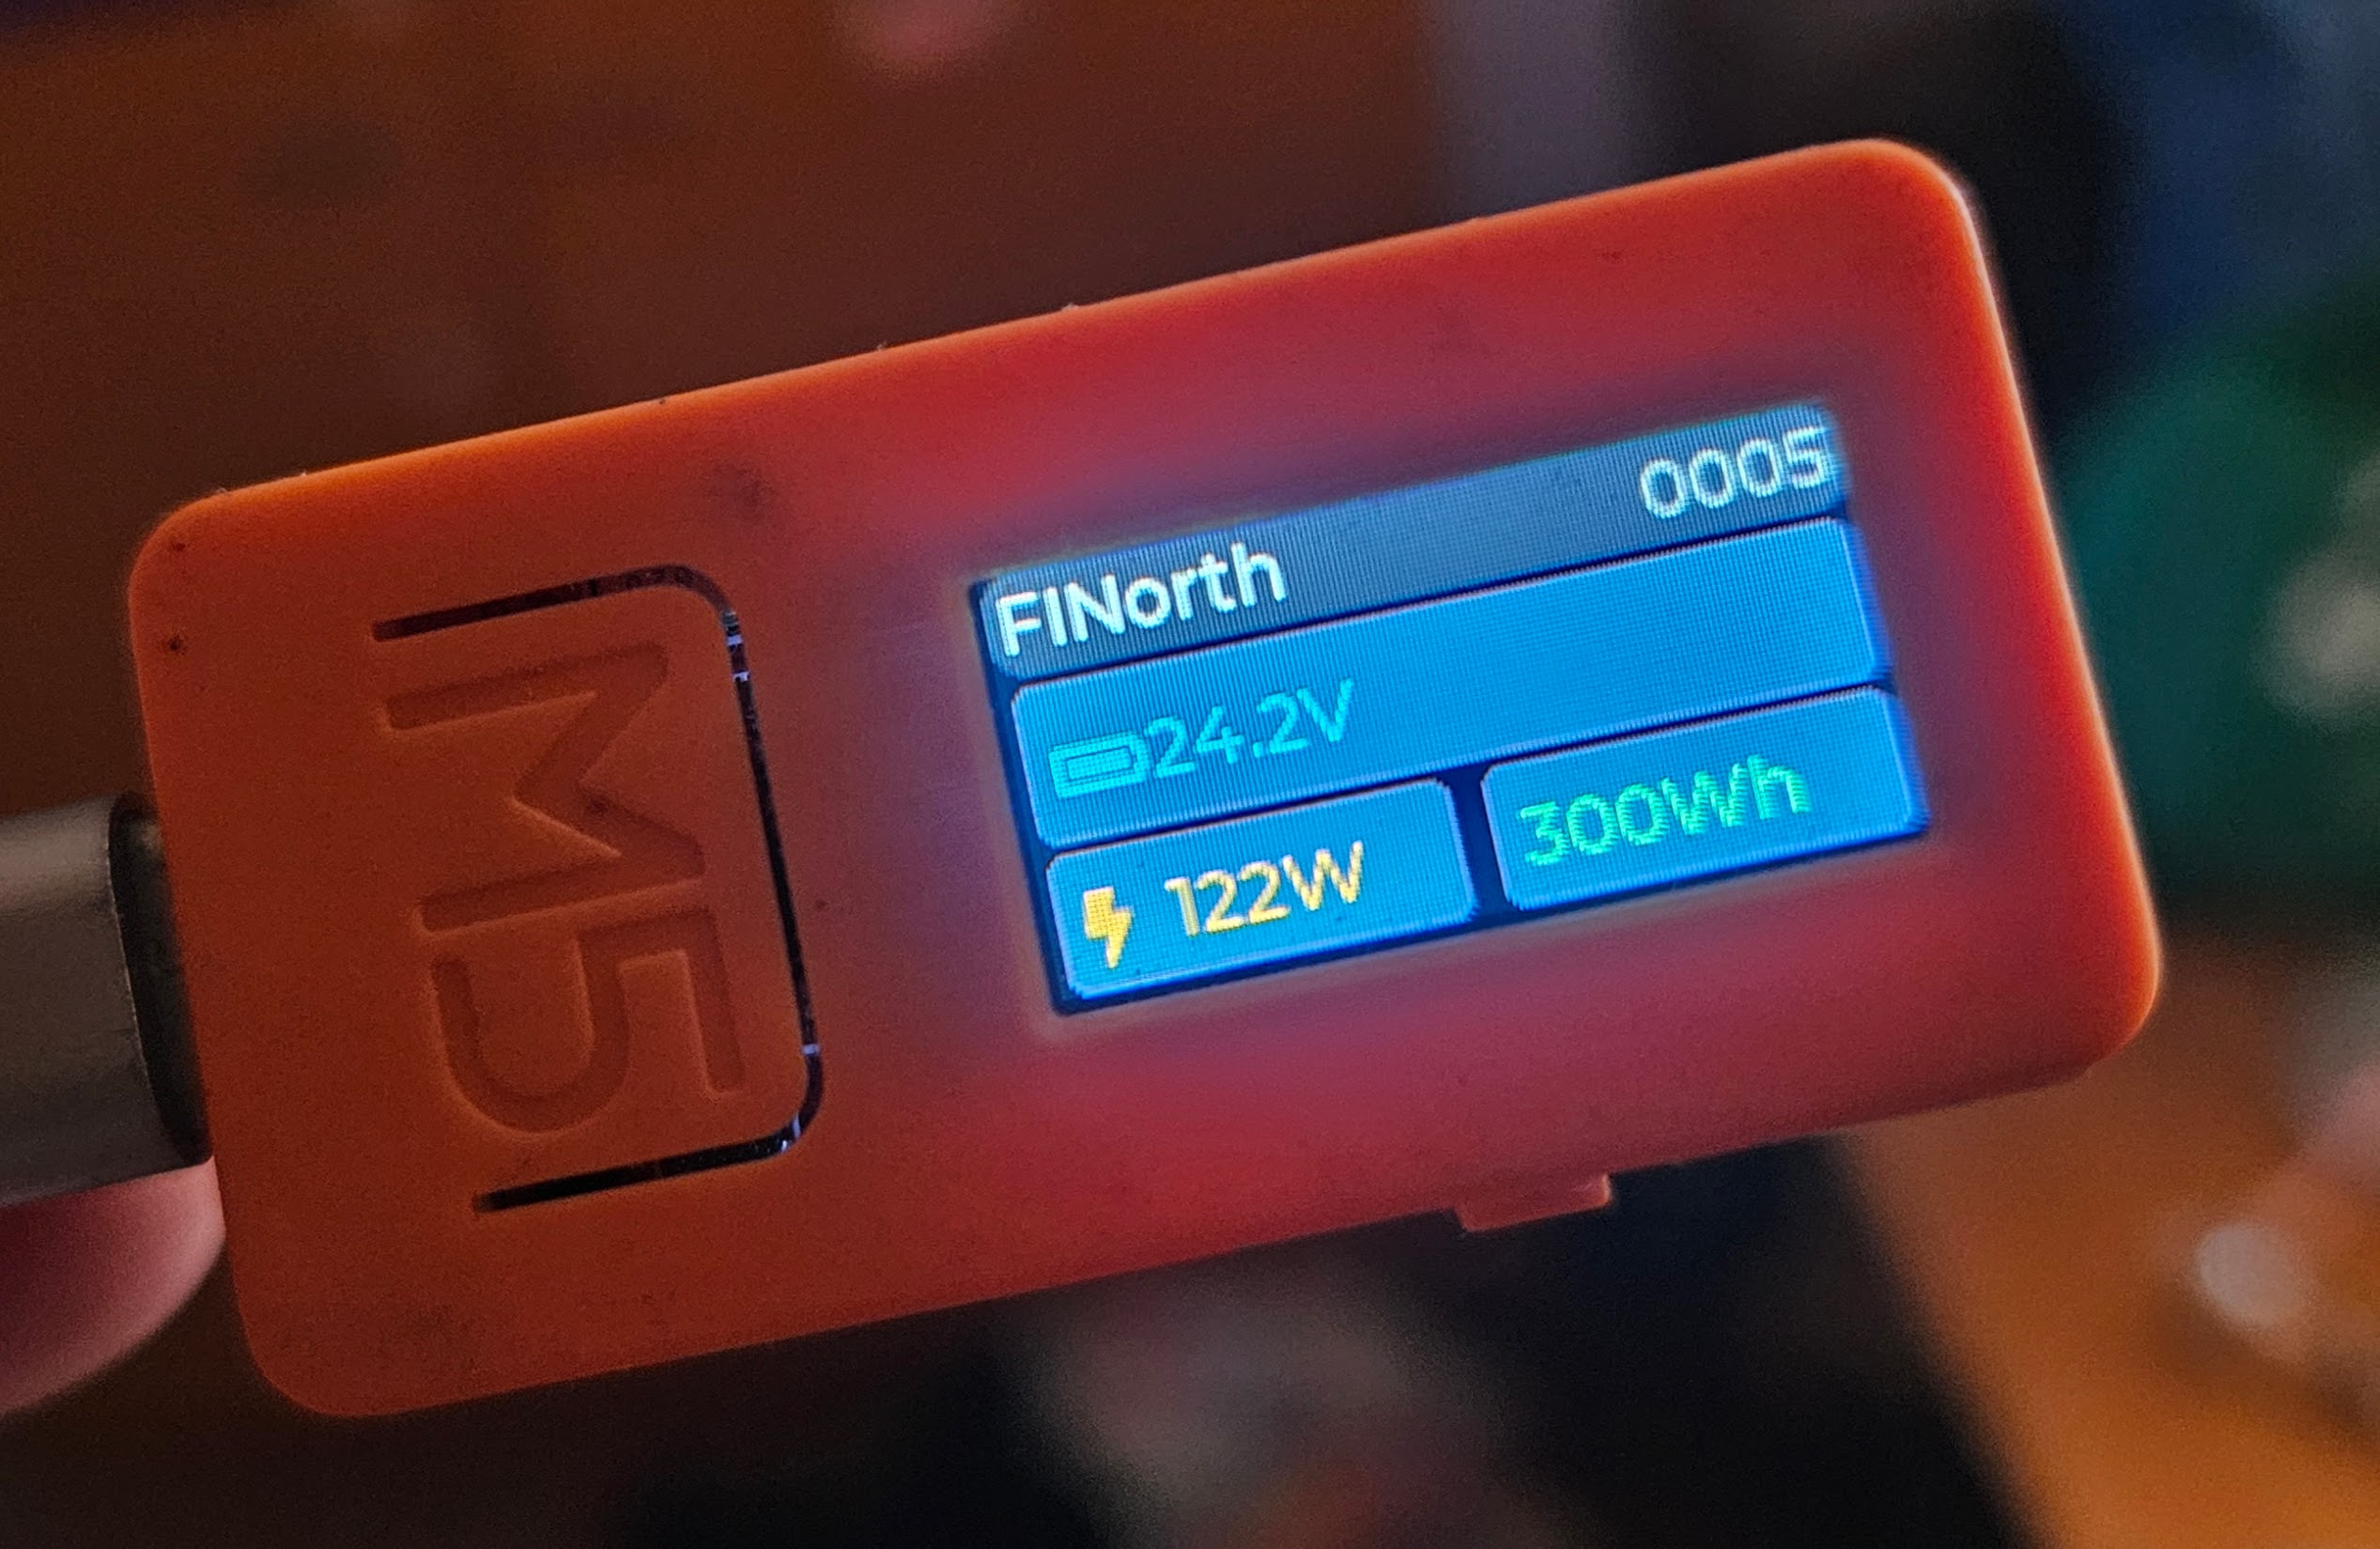
Solar monitoring on a small display: compact, low power and always on
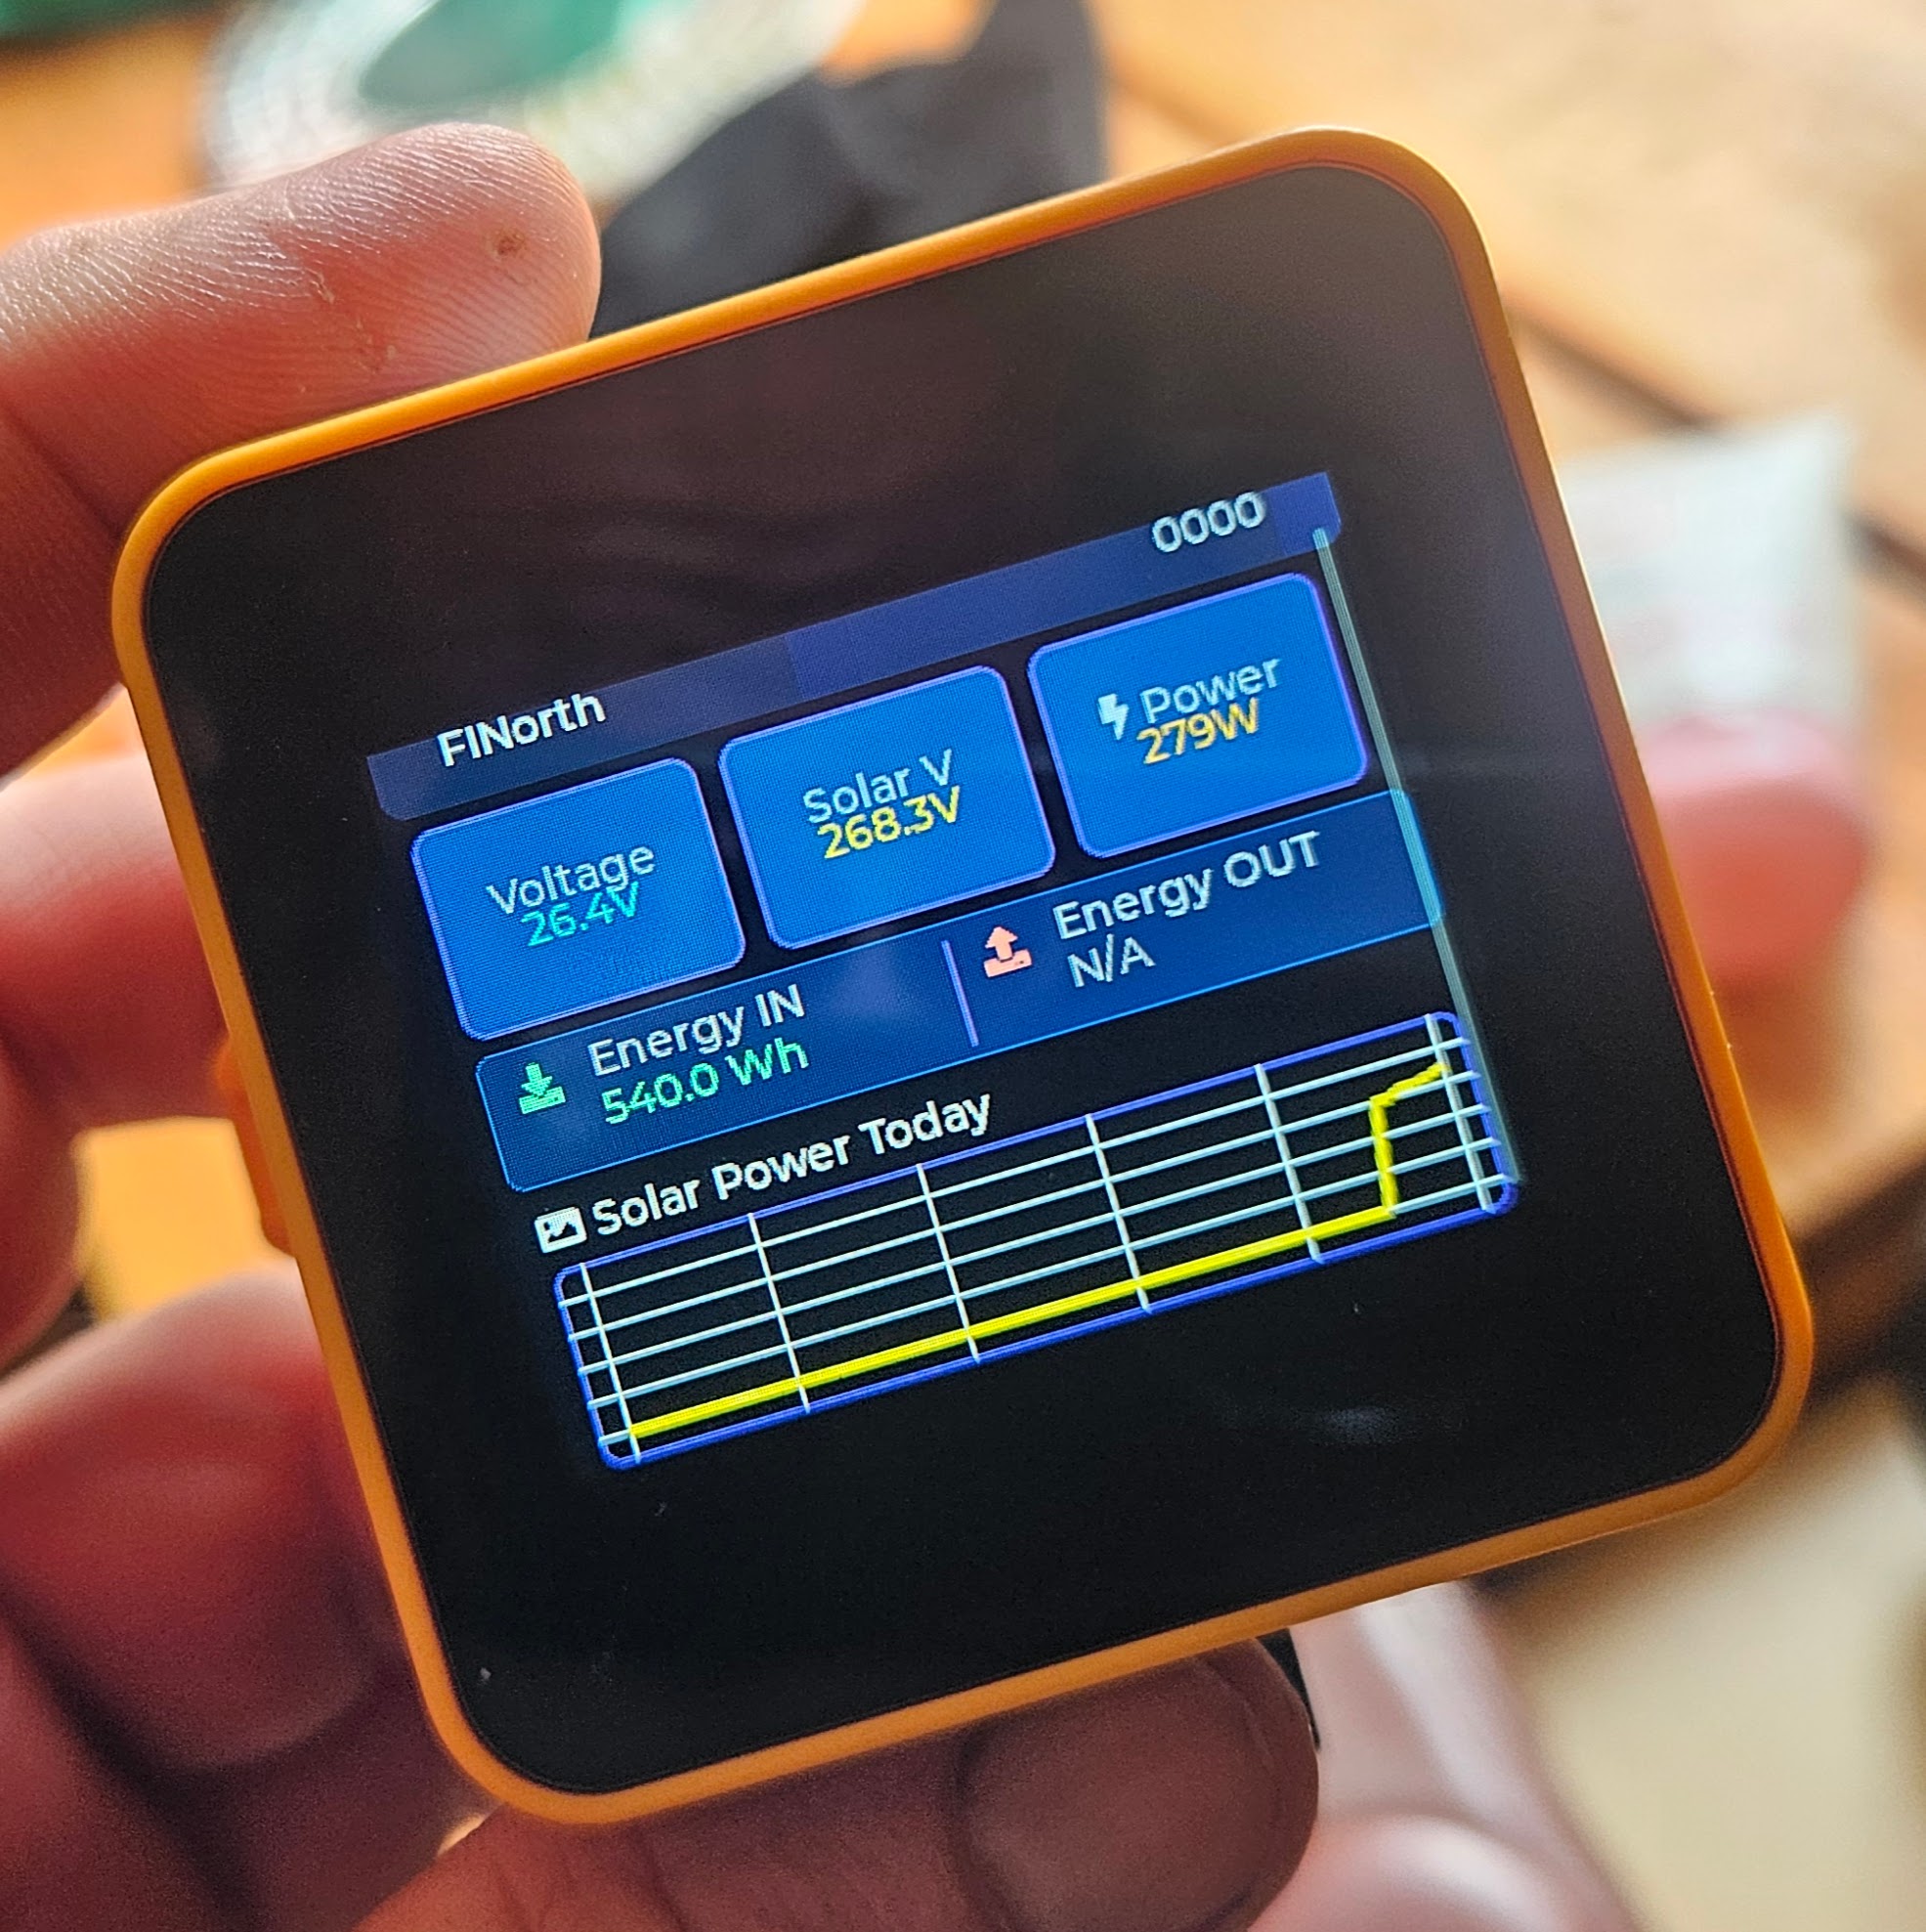
Solar monitoring on a medium display with touch input and scroll navigation
10 - Dashboards
Custom Dashboards
Real-time monitoring, firmware management and device configuration, running on anything from a Raspberry Pi to a full server.
How they are built
Local data: dashboards connect directly to your hardware and data sources
Any size: from compact embedded displays to full-screen monitoring walls
Always on: designed for continuous operation with automatic logging
Low power options: OLED and eInk display support for battery-powered deployments
Examples
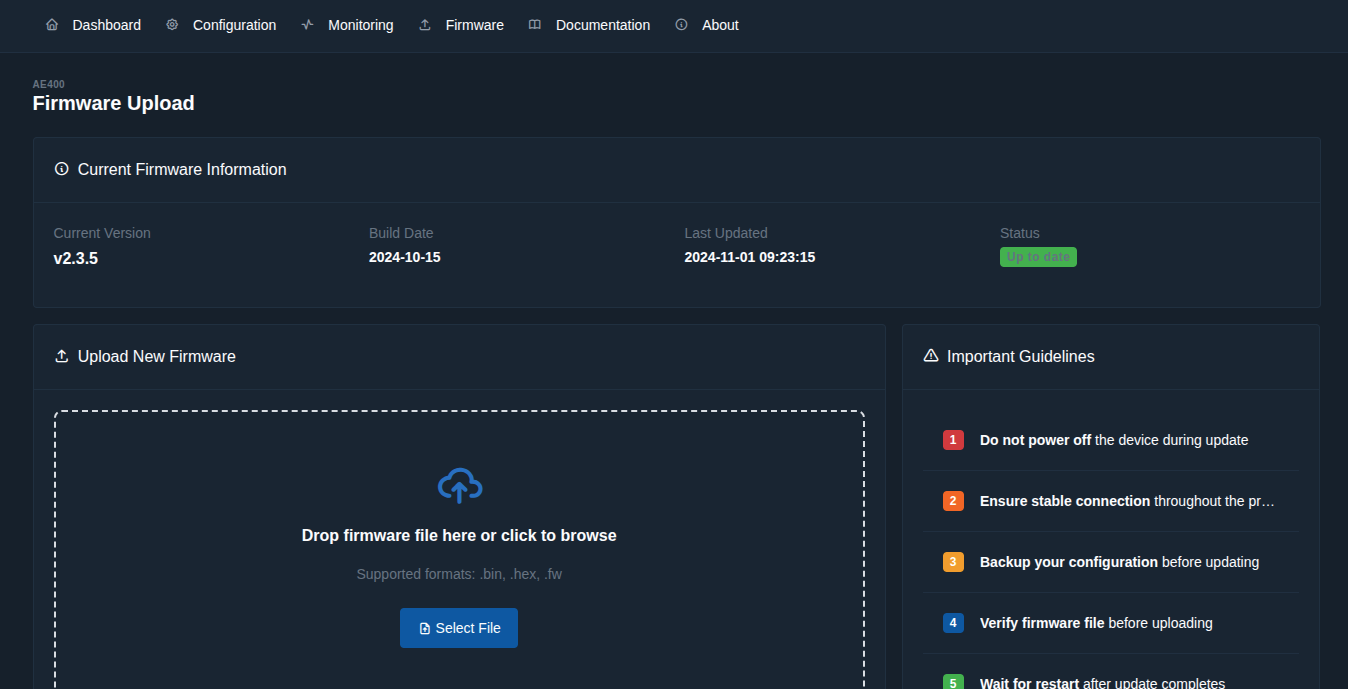
Firmware upload and management
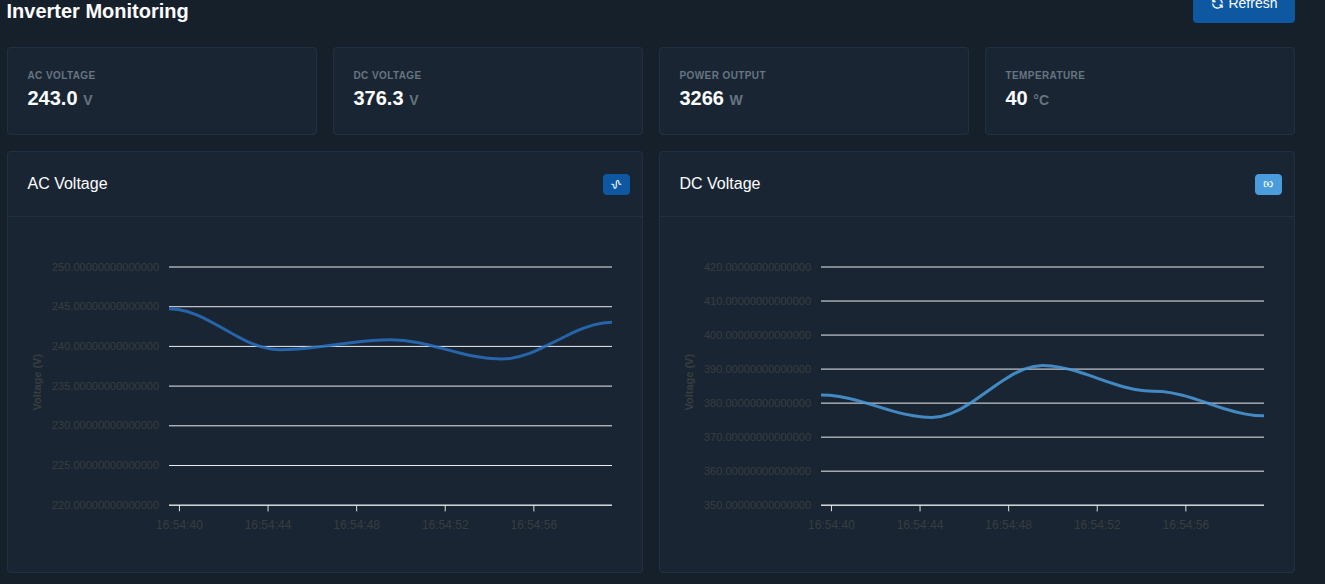
Real-time monitoring
Device settings and configuration
11 - Drones
Custom Drone Platforms
Drones built for research, industrial and remote-environment work, including Antarctic deployments.
Overview
I have designed, built and operated custom drone platforms for several demanding environments. These builds predate the current generation of commercial drones and were built for specific missions.
Heavy Lift
Platforms that lift payloads of up to 20 kg, for carrying research instruments, cameras and sampling equipment in the field.
Waterproof
Sealed electronics and weather-resistant airframes for rain, spray and wet Antarctic conditions.
Antarctic Operations
Flown in support of Antarctic research in 2014, in extreme cold and high winds, far from any workshop.
Local Operations
Aerial photography, surveying and testing in Victoria, Australia, where the Antarctic-bound platforms were proven first.
Builds
Photos
12 - Embedded Dashboards
Single-File Embedded Dashboards
Self-contained HTML dashboards with no external dependencies, designed to run on small devices like the ESP32.
How It Works
A single HTML file containing all SVG, CSS, and JavaScript needed to control and monitor your embedded device. There are no external dependencies and no CDN, so it works with no internet connection.
Example Features:
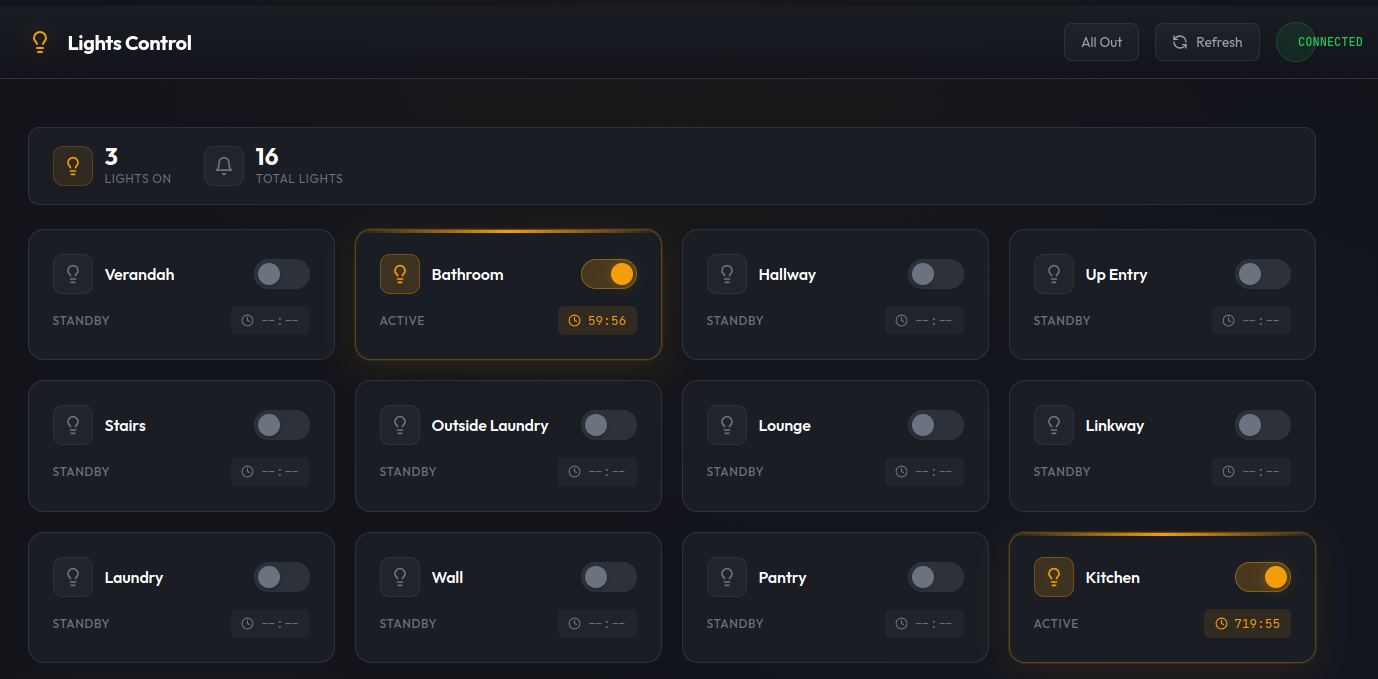
Light controller with auto-discovery
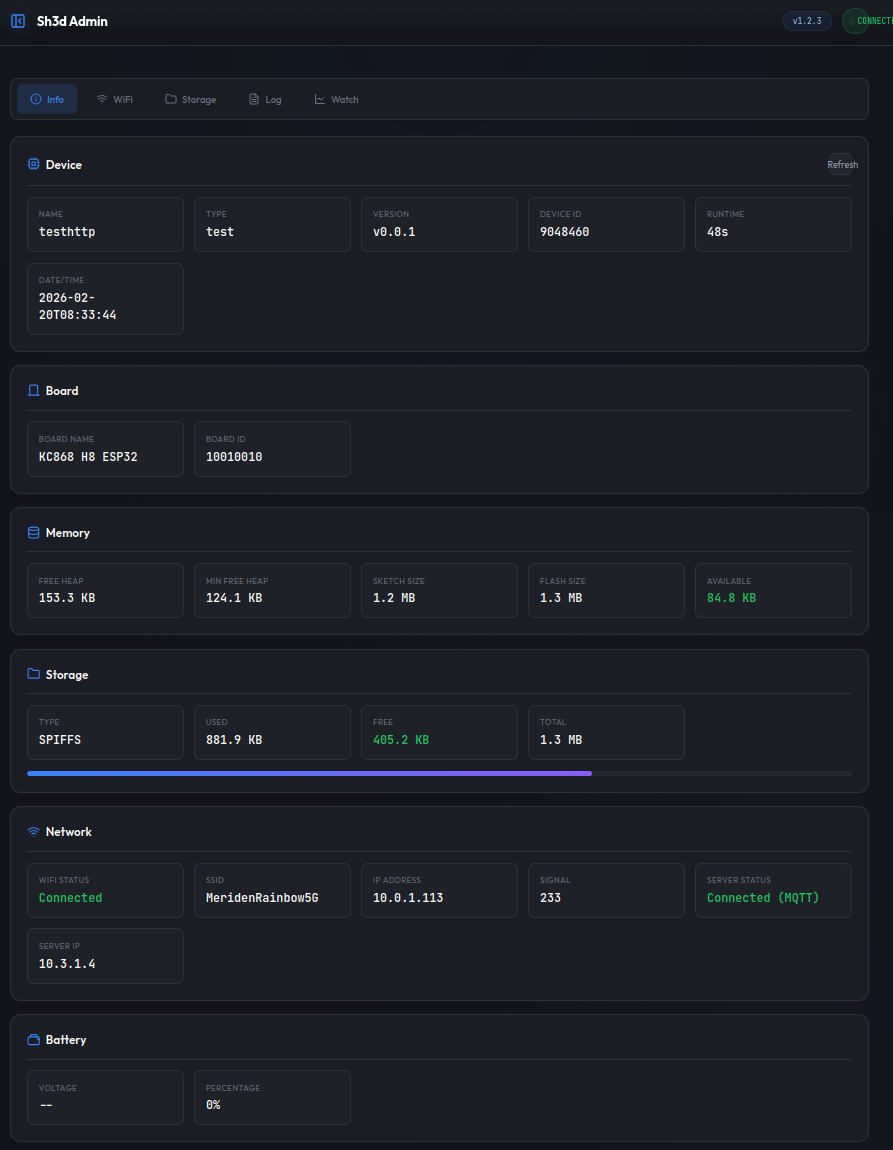
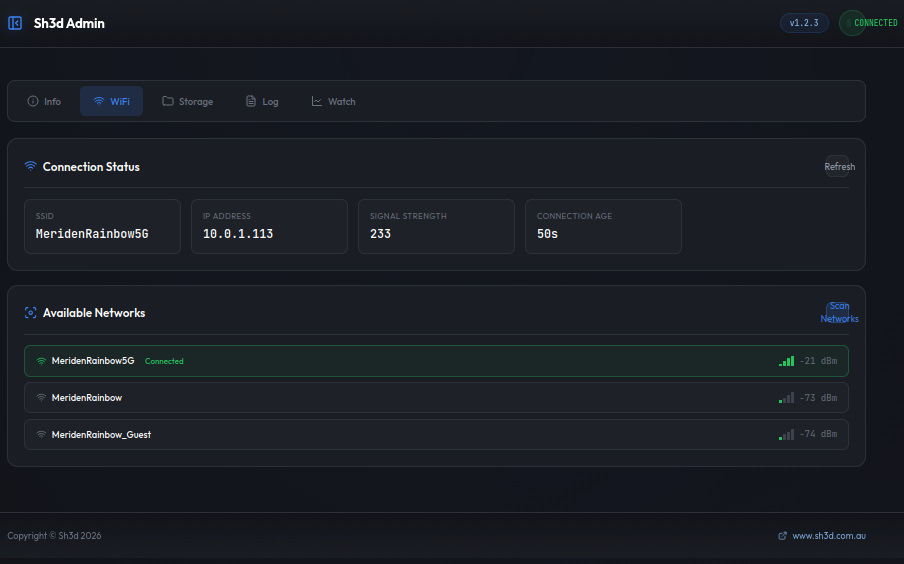
WiFi search and configuration
Full device status and memory monitoring
Multiple chart types for data visualisation
Also Built In:
File management interface
JSON API integration
Auto-discover configurable settings
Responsive design for any screen size
Screenshots
Light controller: auto-discovery checkboxes and status
Full device status including free memory
WiFi search and configuration
Multiple chart types available
13 - WII
Waves In Ice
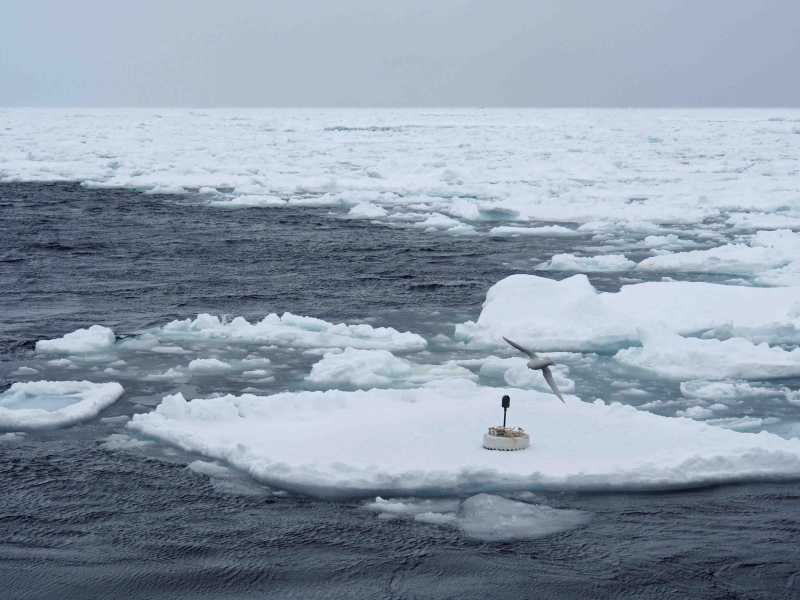
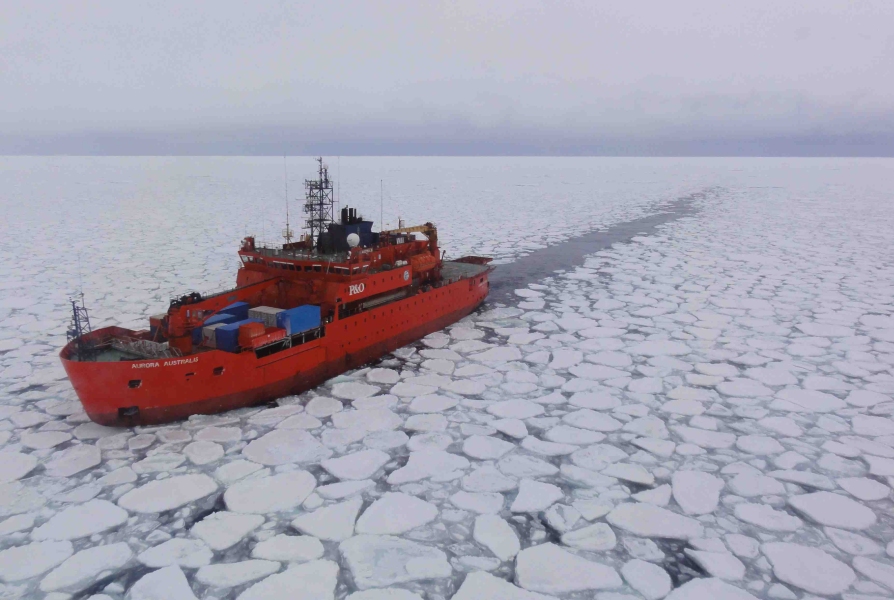
Wave monitoring systems designed for Antarctic sea ice, deployed by research groups in several countries, with results published in Nature.
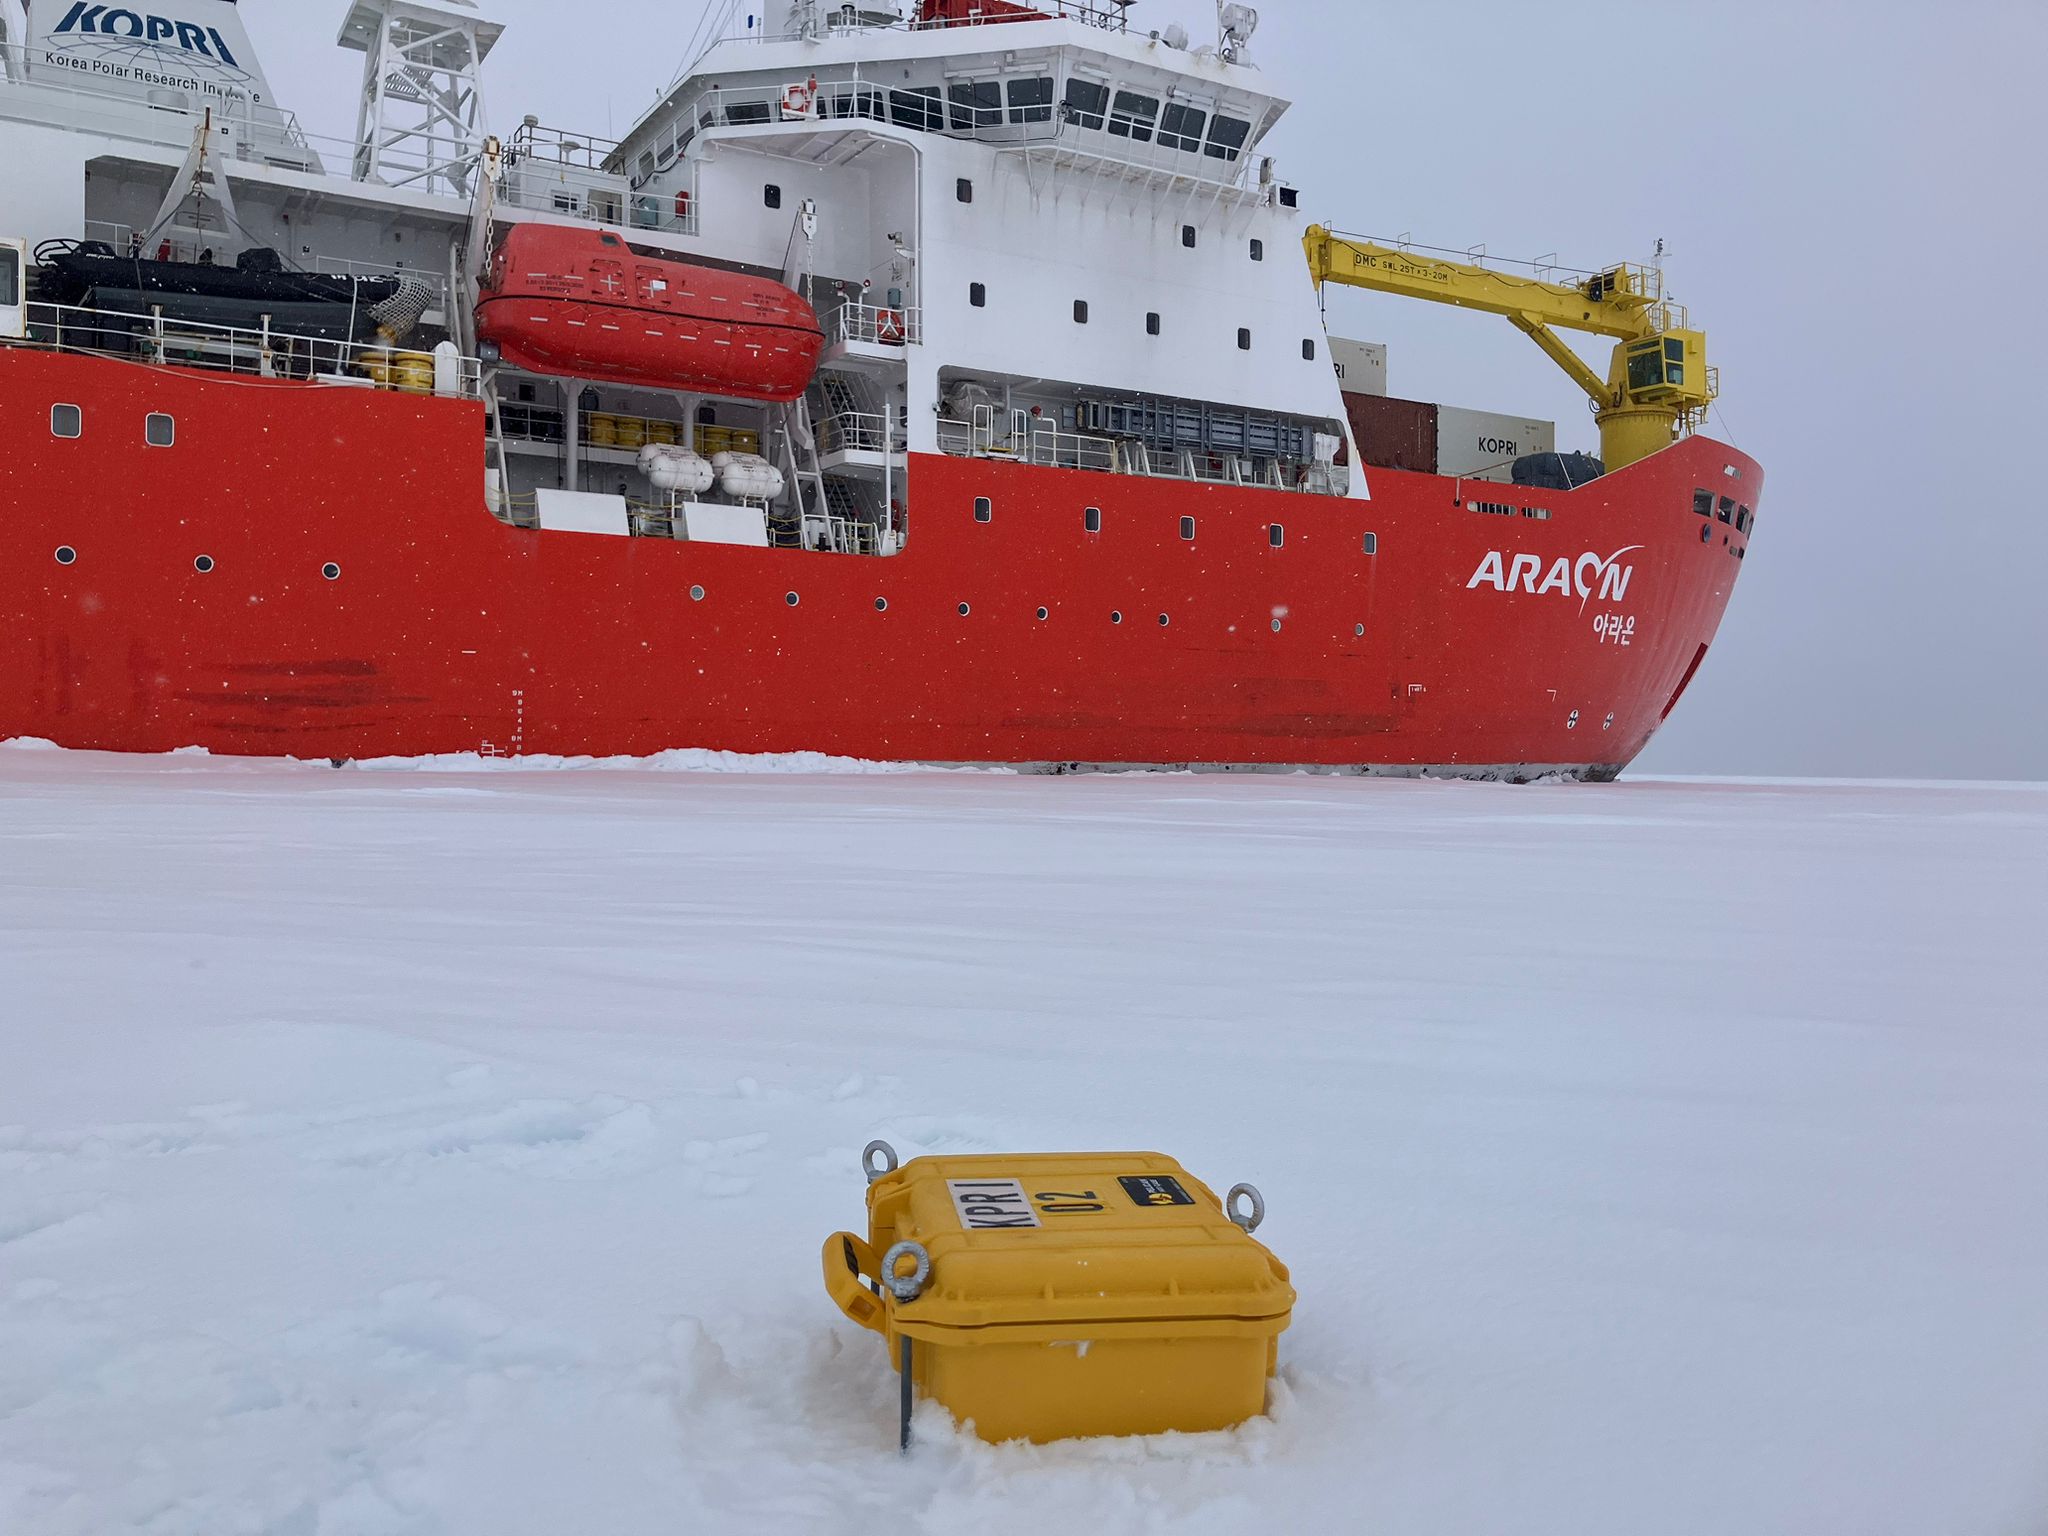
Research by the National Institute of Water and Atmospheric Research (NIWA) in New Zealand found that large ocean waves, particularly those over 3 metres, travel hundreds of kilometres into Antarctic sea ice and are a major force in breaking up floes. The buoys on this page are the instruments that measured those waves from the ice.
Key Findings
Range: large waves from the Southern Ocean can break sea ice 350 to 500 km from the ice edge.
The 3-metre threshold: waves under 3 metres lose their energy quickly, while waves over 3 metres keep the ice pack flexing far from the edge.
Mechanism: as waves pass through the marginal ice zone they break the ice into smaller floes, which winds and currents then deform and break further.
Ice extent: more storms and larger waves in the Southern Ocean are linked to more breakup and retreat of sea ice, particularly near the Antarctic Peninsula.
Climate models: wave-driven fracturing helps explain why some areas of sea ice grow while others recede, and had been underestimated in climate models.
Method: earlier studies were limited by the conditions. NIWA used autonomous instruments on the ice itself to measure the waves directly, including during and after large storms.